INDUSTRIAL ELECTRICAL SYSTEMS ARE COMPLEX ONES
The effects of Power Quality on LED lighting performance generally receive little attention prior to installation. Power quality issues such as dips, harmonics, interruptions, can result in expensive, early replacement of damaged or failed LED lighting equipment.
As a result, end-users are forced to absorb:
- increased Installation costs: over-dimensioning of electrical installation
- increased Operation and Maintenance (O&M) costs: electrical labor costs to remove failed luminaires, replace drivers, and re-hang fixtures.
Electrical environments of industrial plants are very complex and many LED drivers and fixtures are designed without considering it.
Non-linear loads, such as variable-frequency drives (VFDs) and other high-power equipment like induction motors generate power quality disturbances. Other power quality phenomena can be generated by the switching of contactors or may come from outside the plant or caused by meteorological factors.
Industrial buildings need to take Power Quality issues into account before making the change to LED lighting because they can contribute to power quality issues if preparation is overlooked.
Power quality problems can cause a range of costly facility issues, from overheating equipment to power failures and increased utility costs.
LEDs AUTO-CONTRIBUTE TO POOR POWER QUALITY
The same LED lights can be a source of poor power quality.
Issues coming from the LED lighting are:
- Harmonics – LED lights are non-linear loads producing harmonic distortion in the plant’s electrical system, including the lighting one.
- Power Factor – LED drivers with a low power factor reflect harmonics back to the mains. A poor power factor can cause equipment degradation, power losses in your system, voltage drops, and utility company penalty charges.
- Inrush Current – LED lighting with a compensated power factor can cause high inrush current and surges of energy. This can cause damage and malfunction of equipment.
WHAT CAN BE DONE?
It is a good practice to start by documenting the non-linear and high-power loads operating in the building.
As a second step you need to conduct power quality monitoring on your critical, first-tier loads and the panels currently powering the lighting systems.
Every electrical network and its problems with Power Quality are unique and need:
- planning of the measurement campaign,
- preparing the site,
- measuring activity,
- and finally understanding where the problem is.
THE ELECTREX MONITORING SOLUTIONS AND POWER QUALITY ANALYZERS
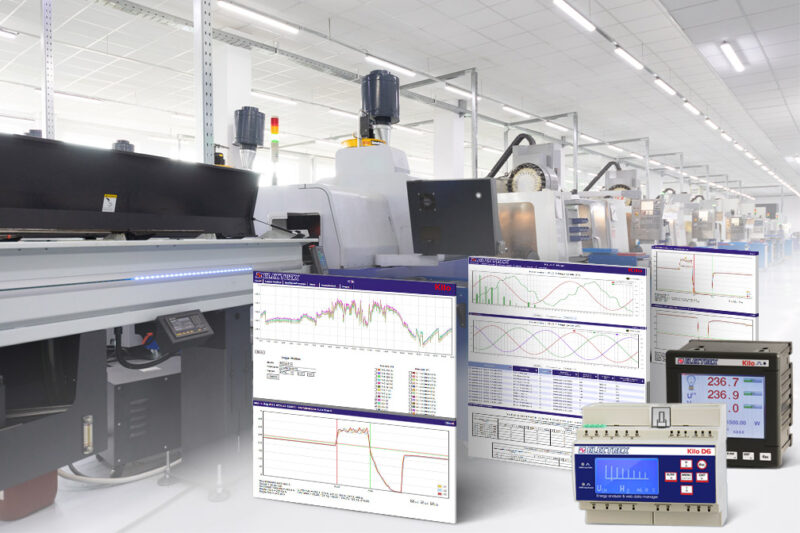
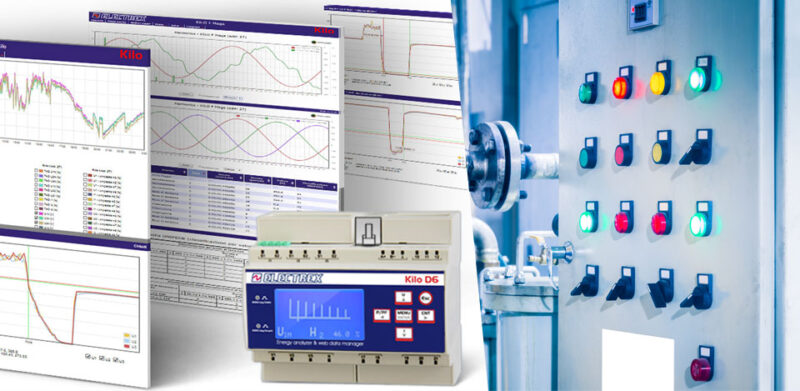
Electrex, permanent or portable, Power Quality Energy Analyzer & Web Data Manager devices are designed to monitor and analyze Power Quality.
Our devices are IoT-type, including an embedded web interface and communication ports that make it possible to display measurements and control the device remotely.
In addition, it is possible to activate an embedded “energy PLC” functionality allowing to creation energy automation applications within the same energy analyzer.
Our Power Quality analyzers can be used for:
- the recording of PQ events
- preventive maintenance on the LED lighting system
- PQ measurement campaigns for specific periods defined from the user
- monitoring of the compliance with PQ standards or service standards
The final step instead is focused on analyzing the power quality data. As in many other fields, in-depth analysis will require power quality experts.
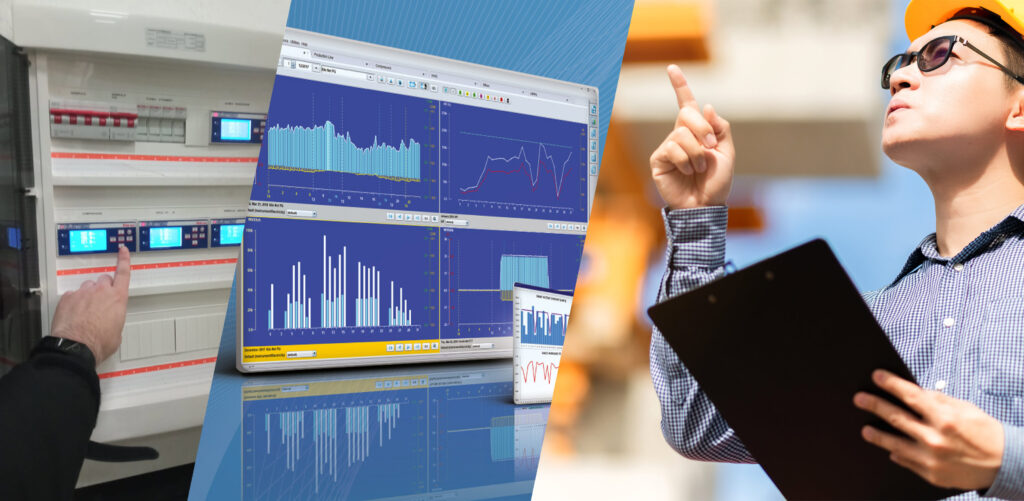
In order to support end users and professionals with data understanding the Electrex Power Quality analyzers include, among other functionalities, the “event’s graphic detail” and “events timeline” which can display detailed info of each event and a timeline of the succession of events
Included in the embedded web server, the graphs and charts, permit also to a non-expert user to identify the statistical frequency, magnitude, and the possibility of causing a malfunction.
Other functions, for example, permit identifying the direction compared to the monitoring point, therefore identifying the source of the disturbance.
Summarizing, the success of any LED lighting project—whether it’s a retrofit or new industrial construction—is the understanding, identification, resolution


